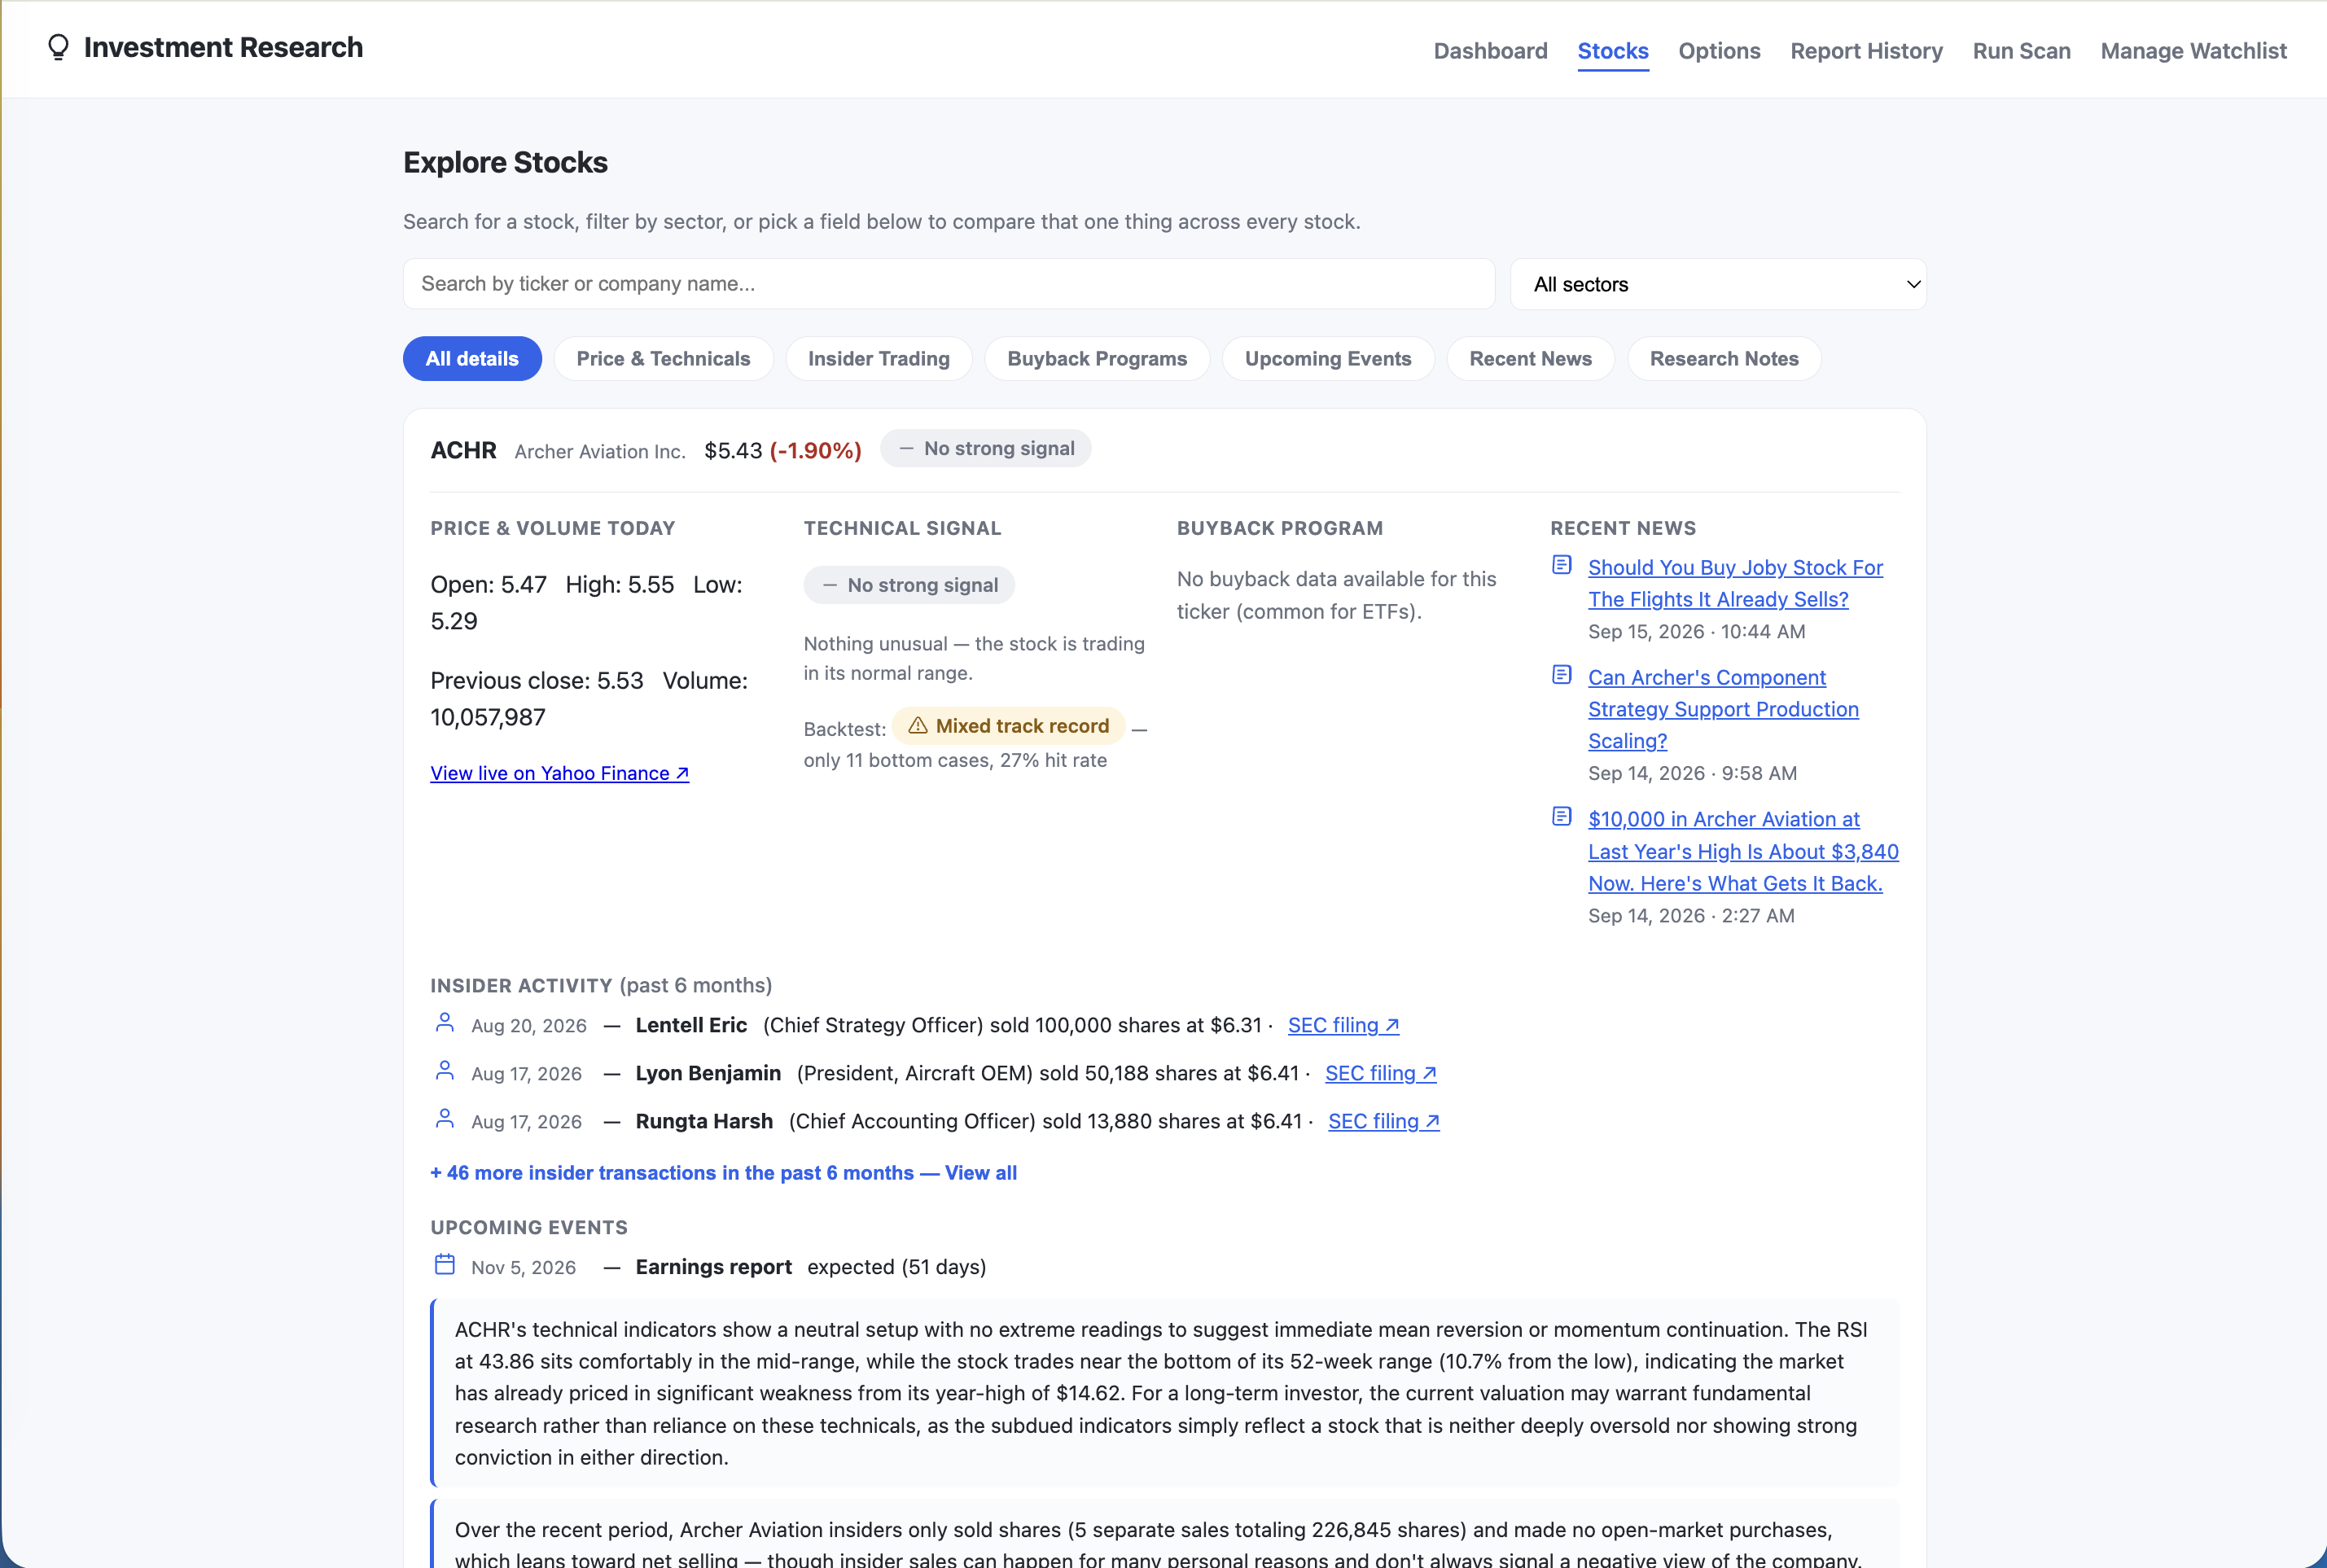
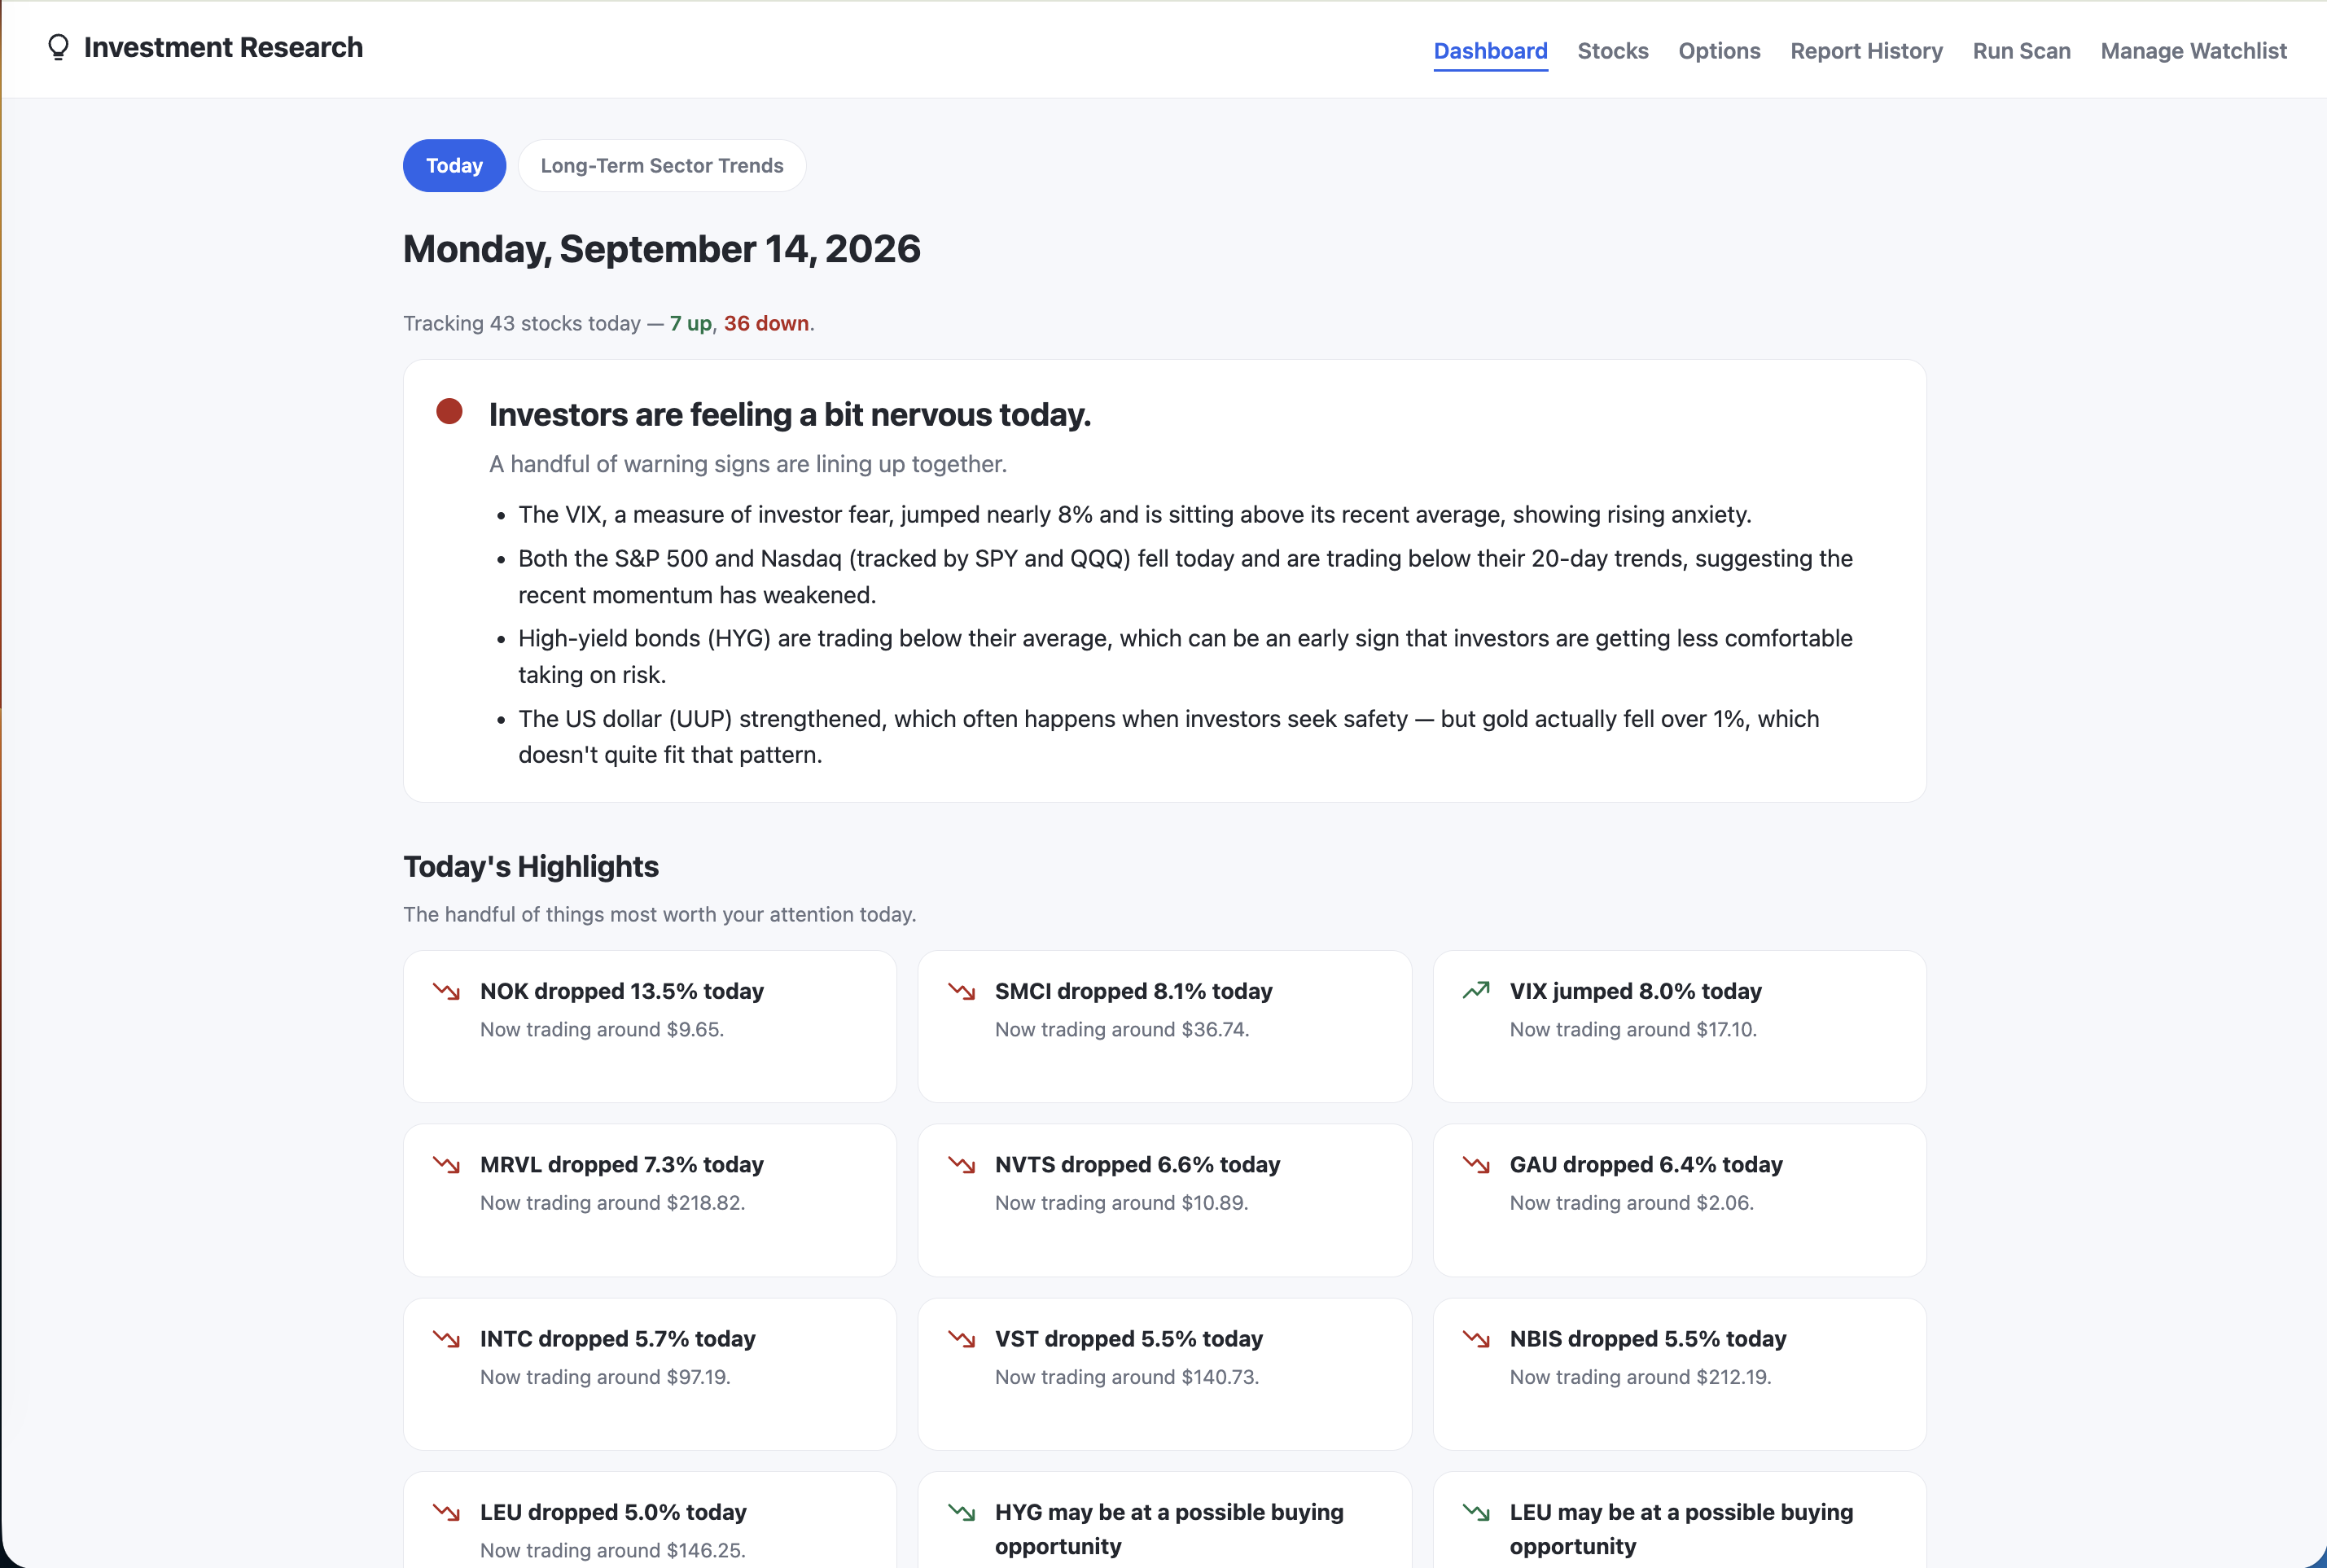
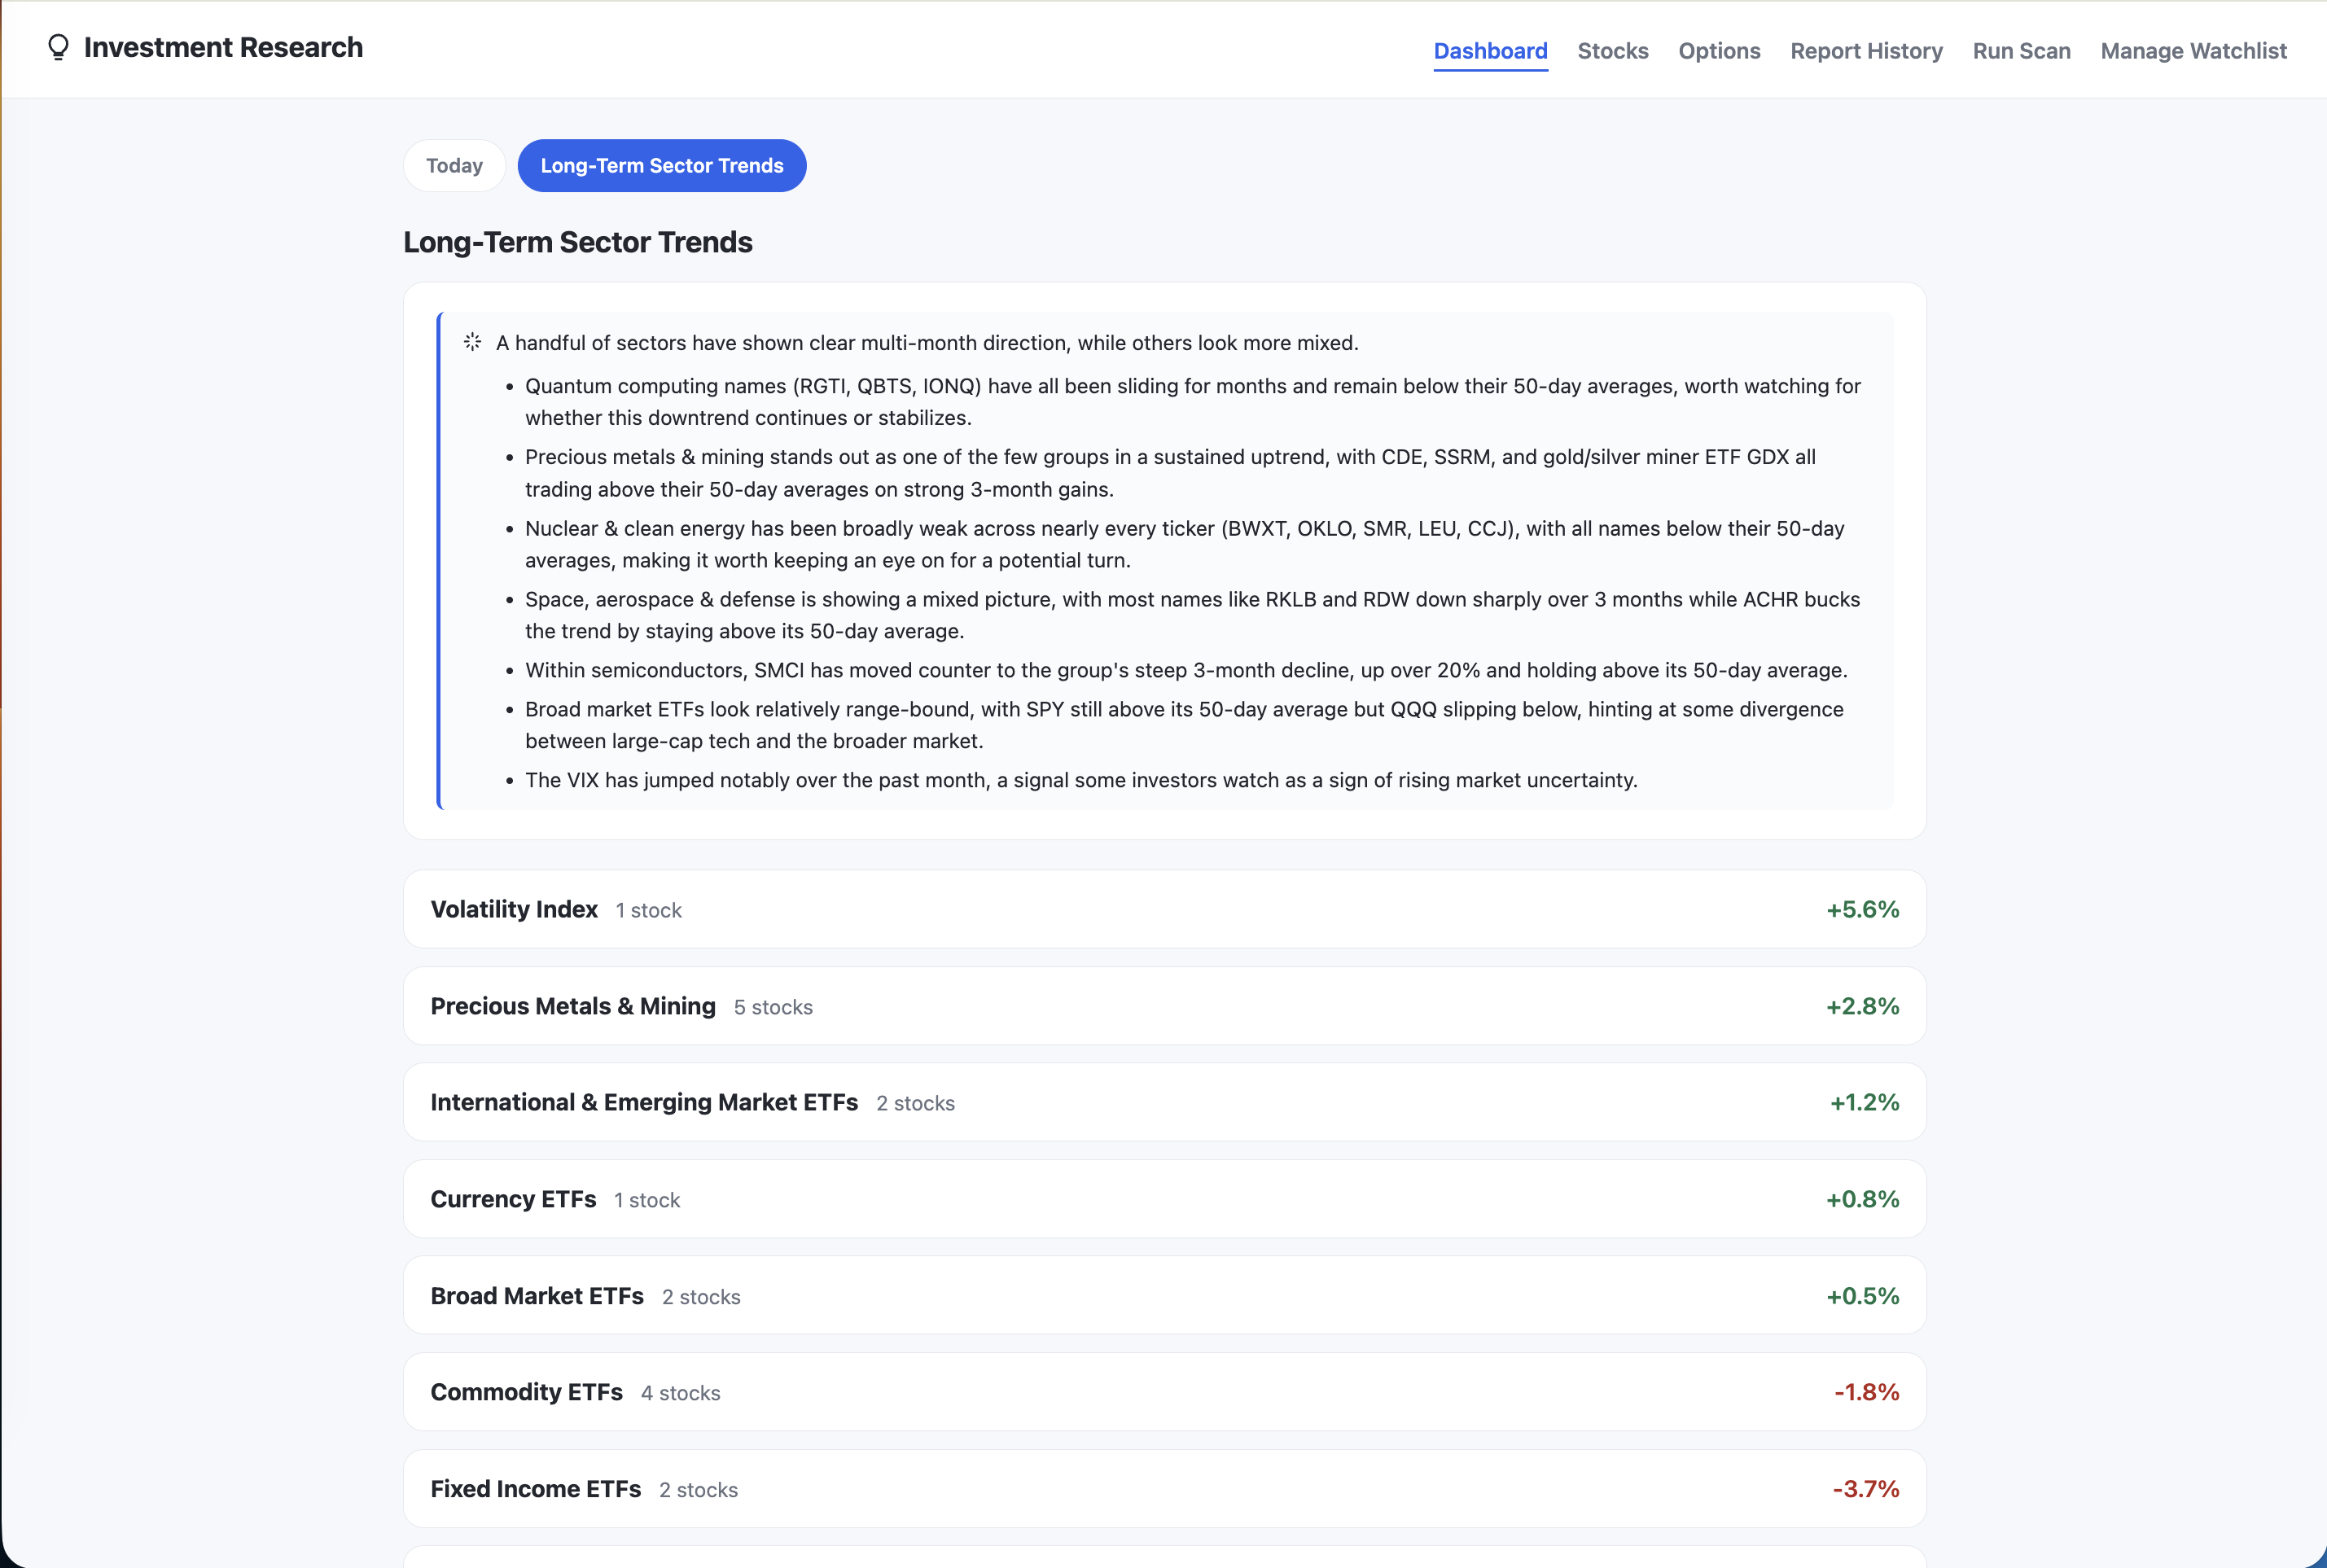
Built a multiagent AI platform that automates investment research across sector based equity watchlists. The project combines LLM reasoning and summarization with financial data pipelines, quantitative indicators, and historical backtesting to connect company developments, price behavior, and market conditions.
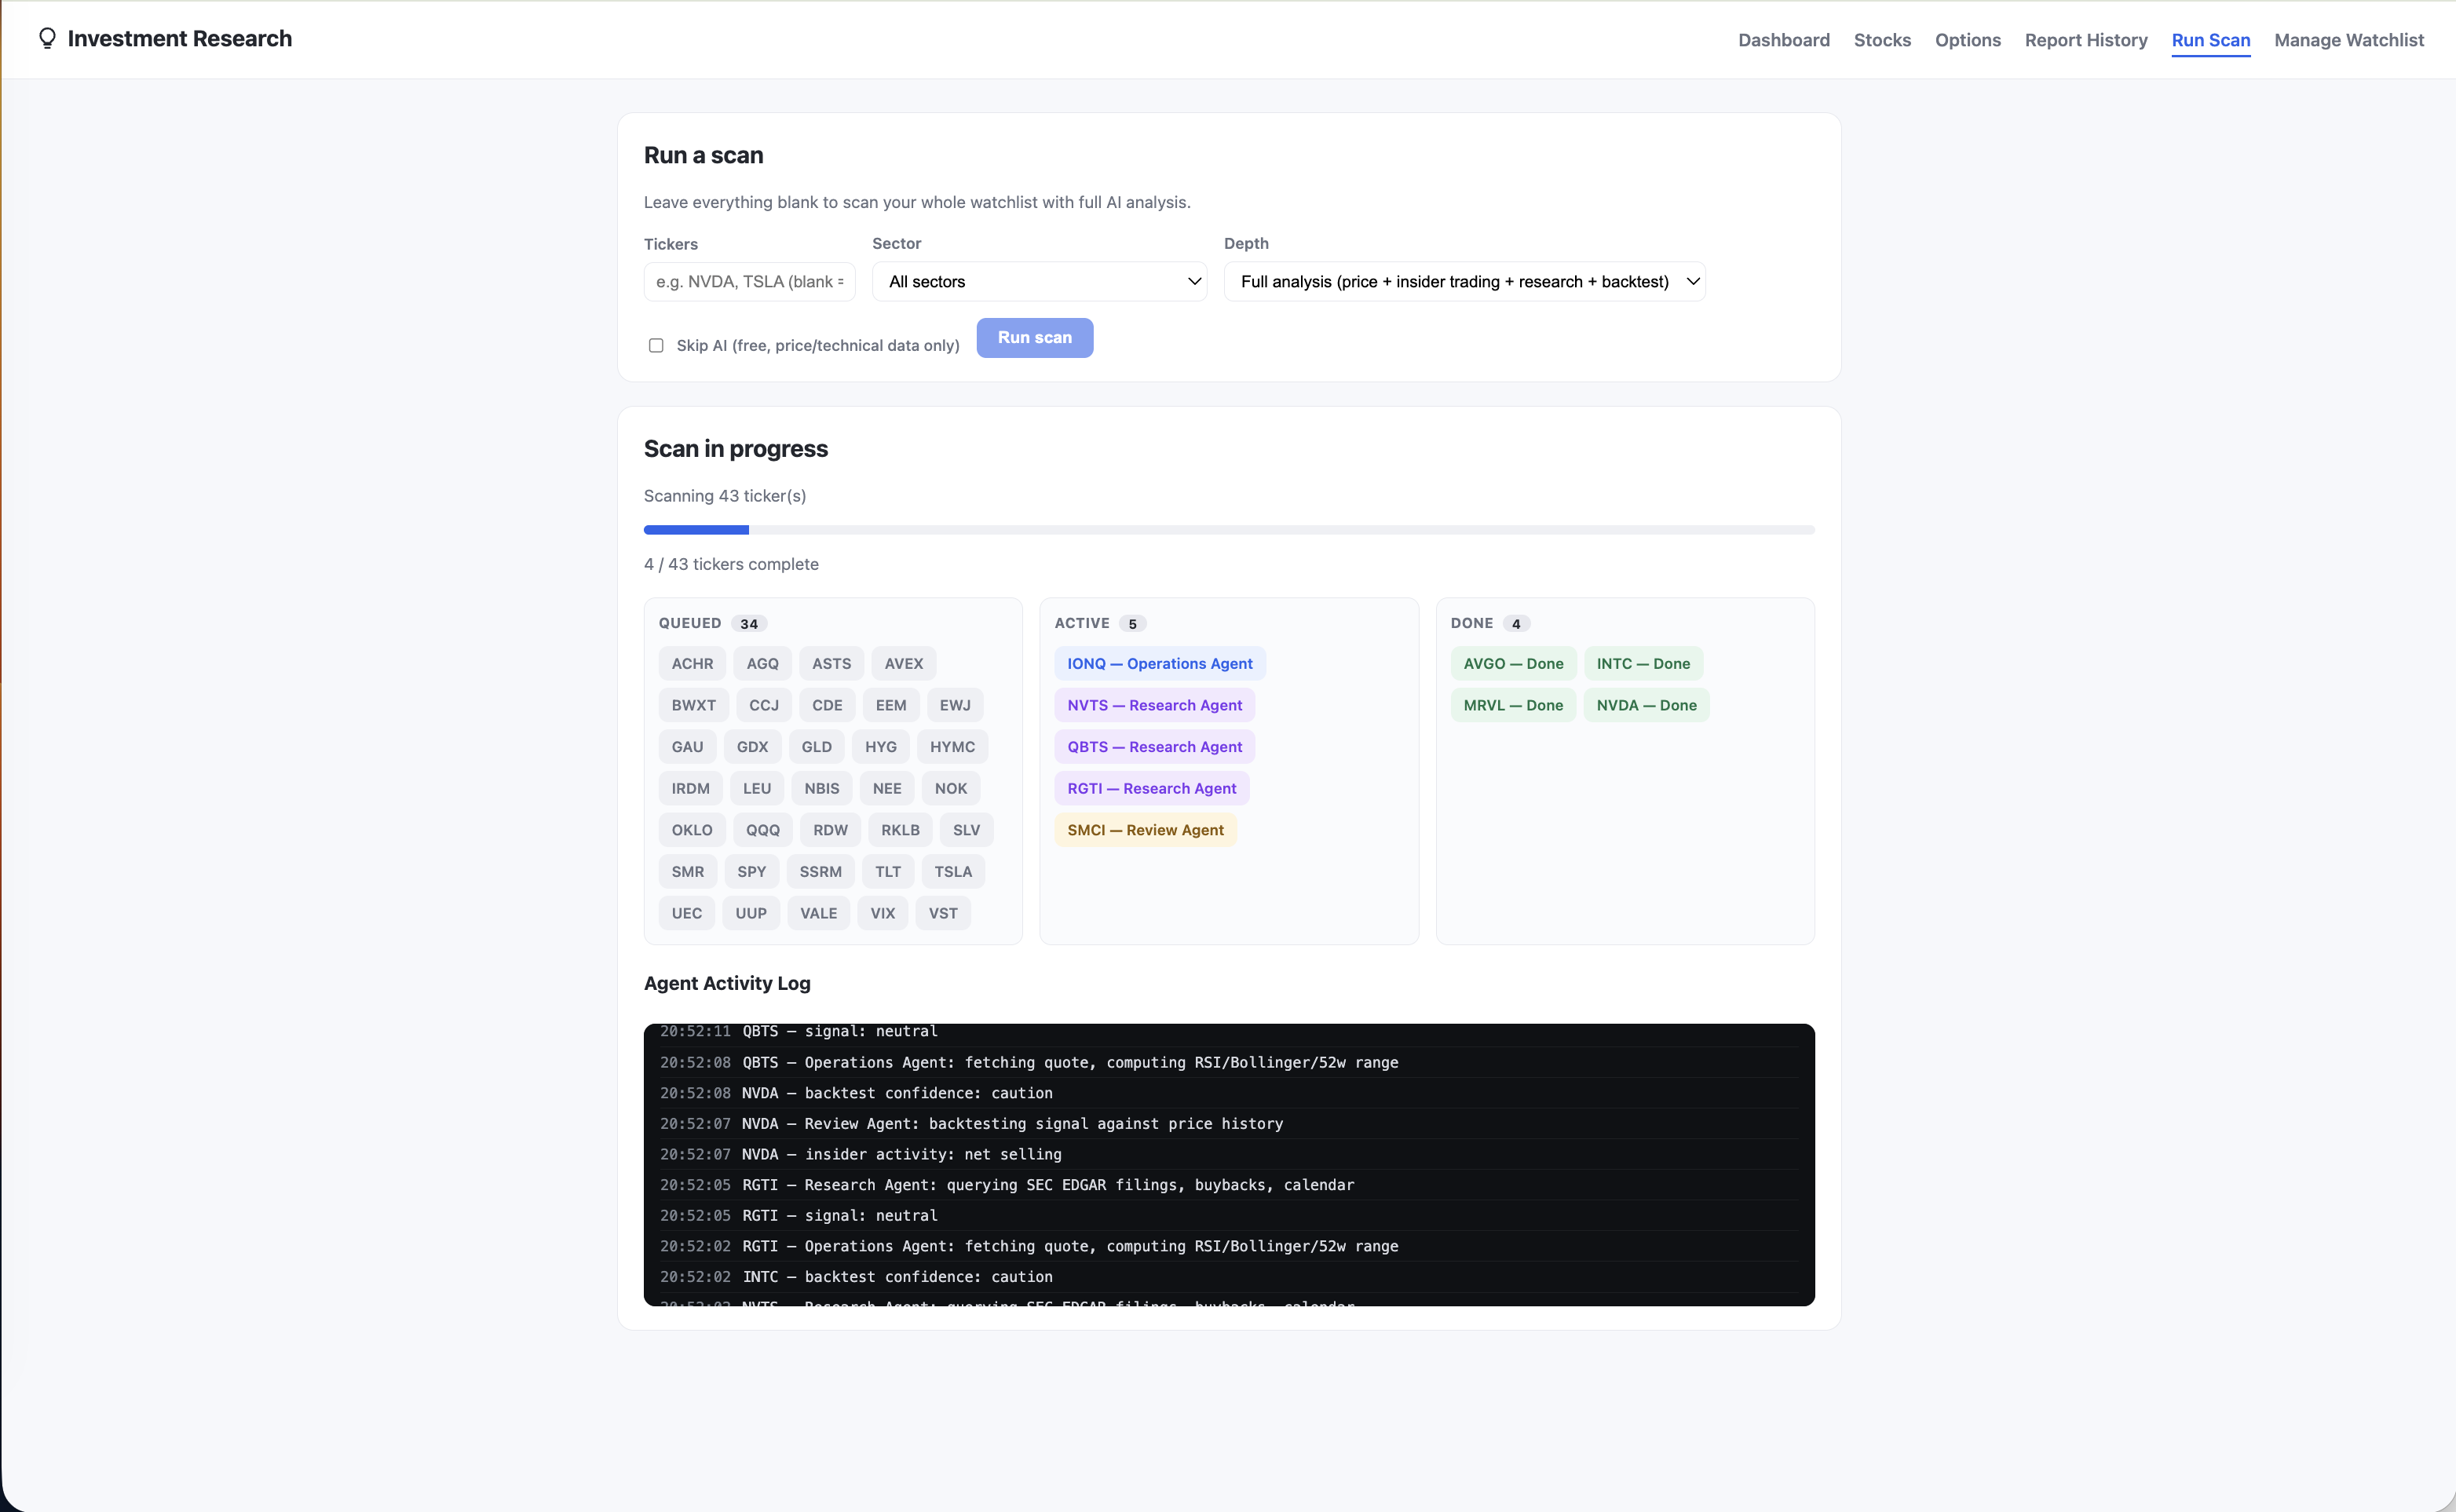
Designed a hierarchical orchestration workflow in Python using the Claude API. Specialized agents analyze technical signals, corporate activity, market sentiment, and historical evidence, while a portfolio manager agent consolidates their findings into an executive summary. Ticker research runs concurrently through a thread pool, with explicit dependencies between stages, including passing technical signals into the review agent for assessment.
The AI architecture includes:
- Task decomposition and specialized prompting: Defined distinct agent responsibilities and financial context to keep each model call focused on a bounded research task.
- Structured outputs: Used JSON Schema constrained responses and parsed JSON results to connect model outputs to downstream analysis, report generation, and dashboard components.
- Tool use infrastructure: Implemented a reusable Claude client with a bounded tool calling loop that dispatches requested functions, returns results to the model, and handles tool execution failures.
- Grounded financial interpretation: Supplied agents with programmatically retrieved market data, SEC filings, and computed indicators so their analysis references explicit inputs.
- Hybrid AI and quantitative processing: Calculated technical indicators and backtest statistics in Python, then used LLMs to interpret the evidence and communicate findings.
- Context aggregation and synthesis: Compressed specialist results into a structured context for the portfolio manager, enabling synthesis across companies and market conditions.
- Operational controls: Added configurable models, token usage and estimated cost tracking, bounded response budgets, error handling, and deterministic fallback paths.
The financial pipeline evaluates RSI, Bollinger Bands, moving averages, and 52 week price positioning alongside insider transactions, share repurchase spending, earnings events, and news. Cross asset indicators provide context on market risk appetite, while historical signal backtests report hit rates and sample sizes to support evidence based interpretation.
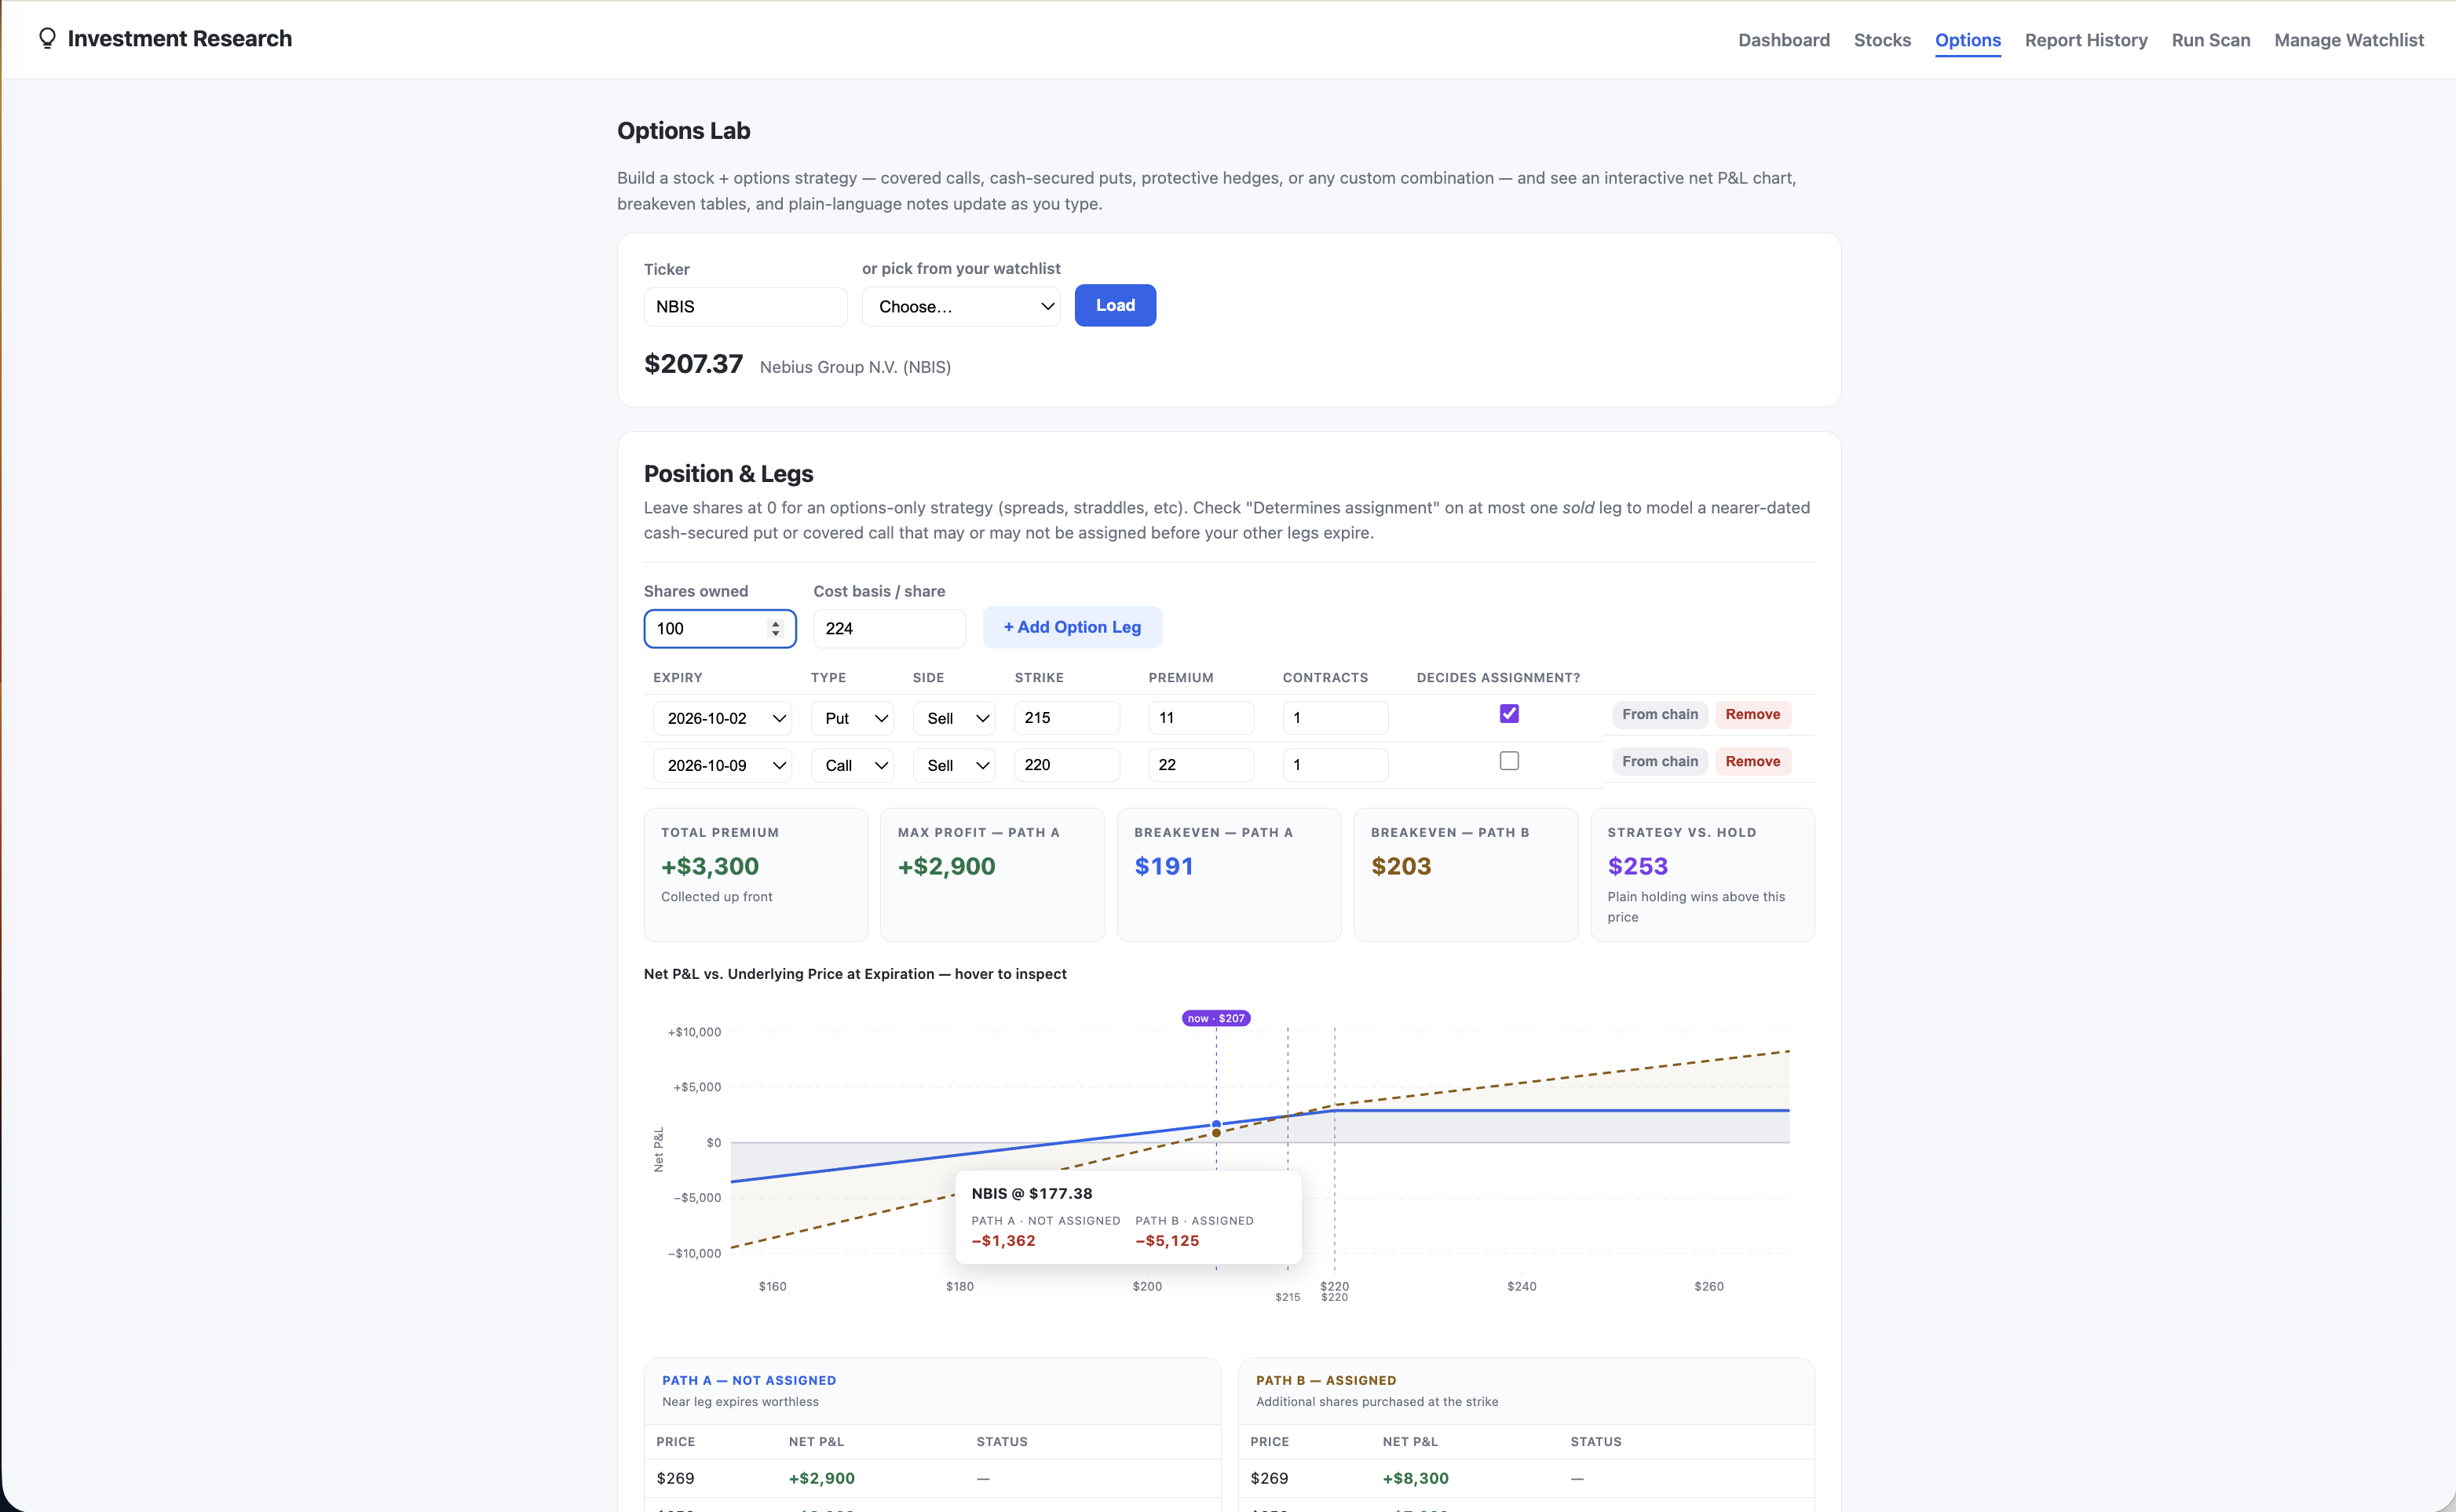
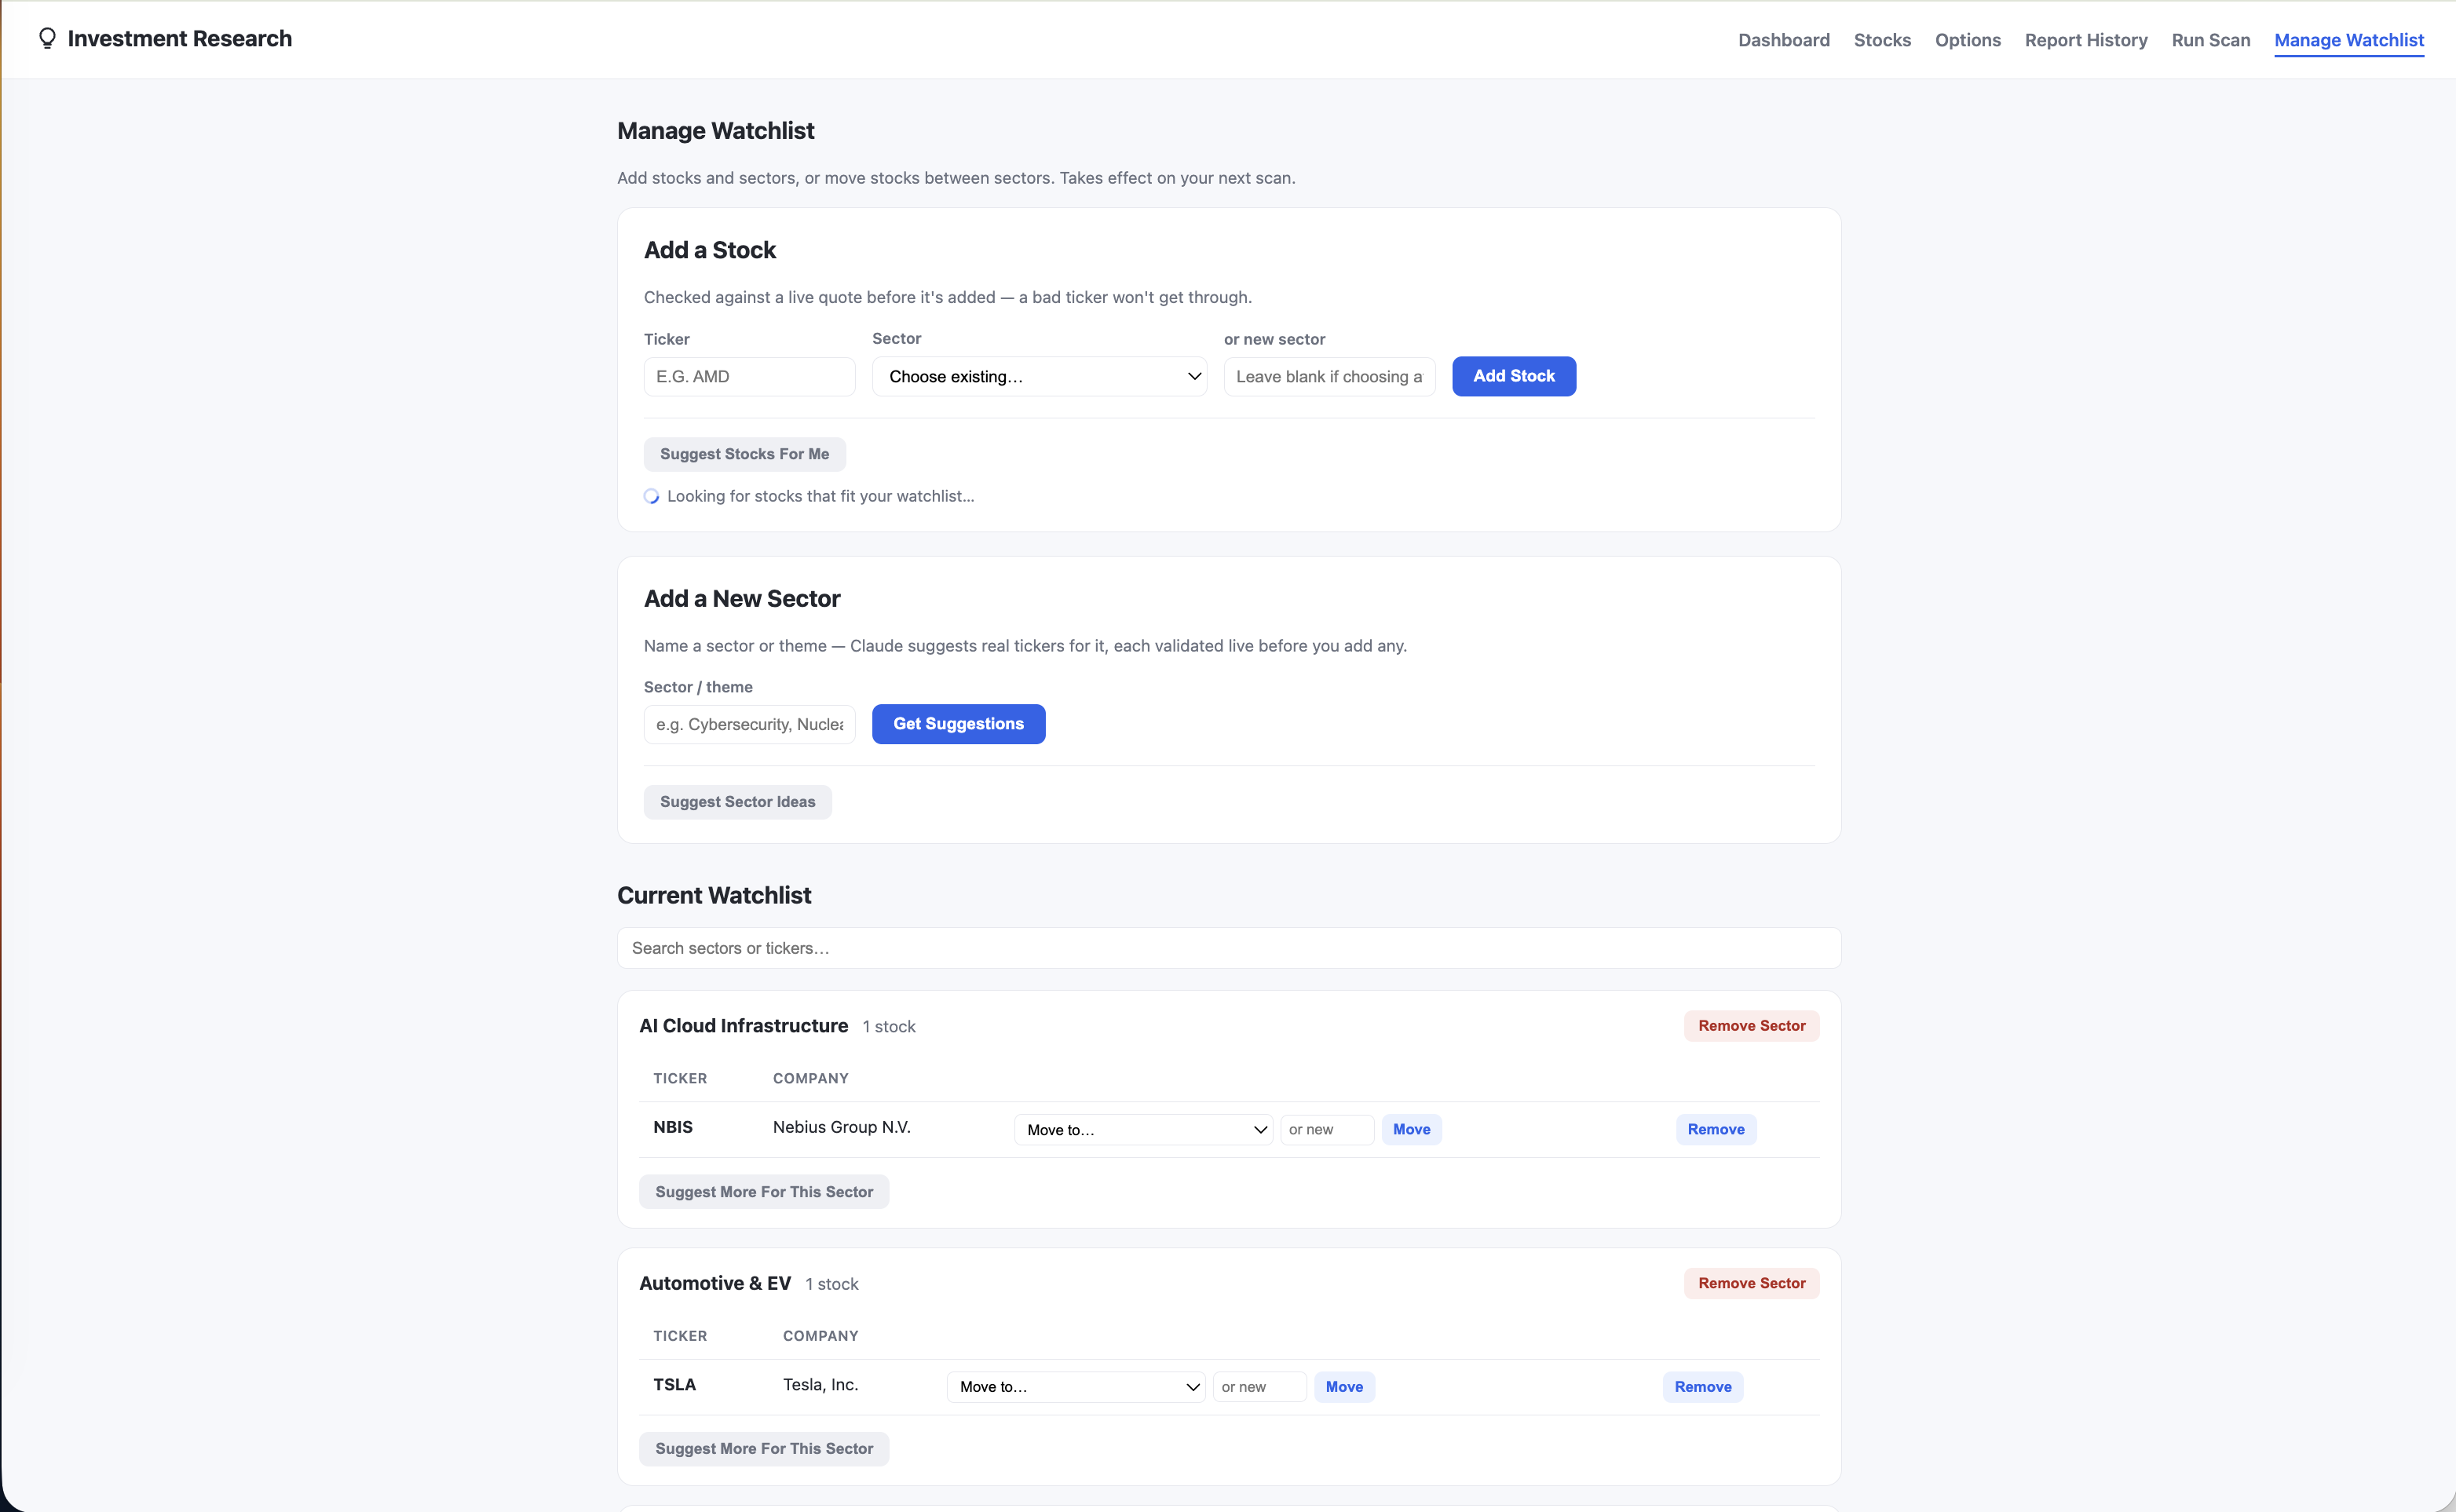
Built a Flask dashboard with automated daily scans, sector comparisons, research history, and watchlist management. An interactive options lab integrates live options chains with configurable stock and option positions, visualizing expiration profit and loss, breakeven points, and the tradeoffs between premium income, downside protection, and capped upside.
← Back to PortfolioGallery